TIERS calculates federal, state, and international allocations across the full tiered structure in a single, atomic pass. It removes the need to pick up values through linked workbooks and maintains all details necessary to trace every result back to its source.
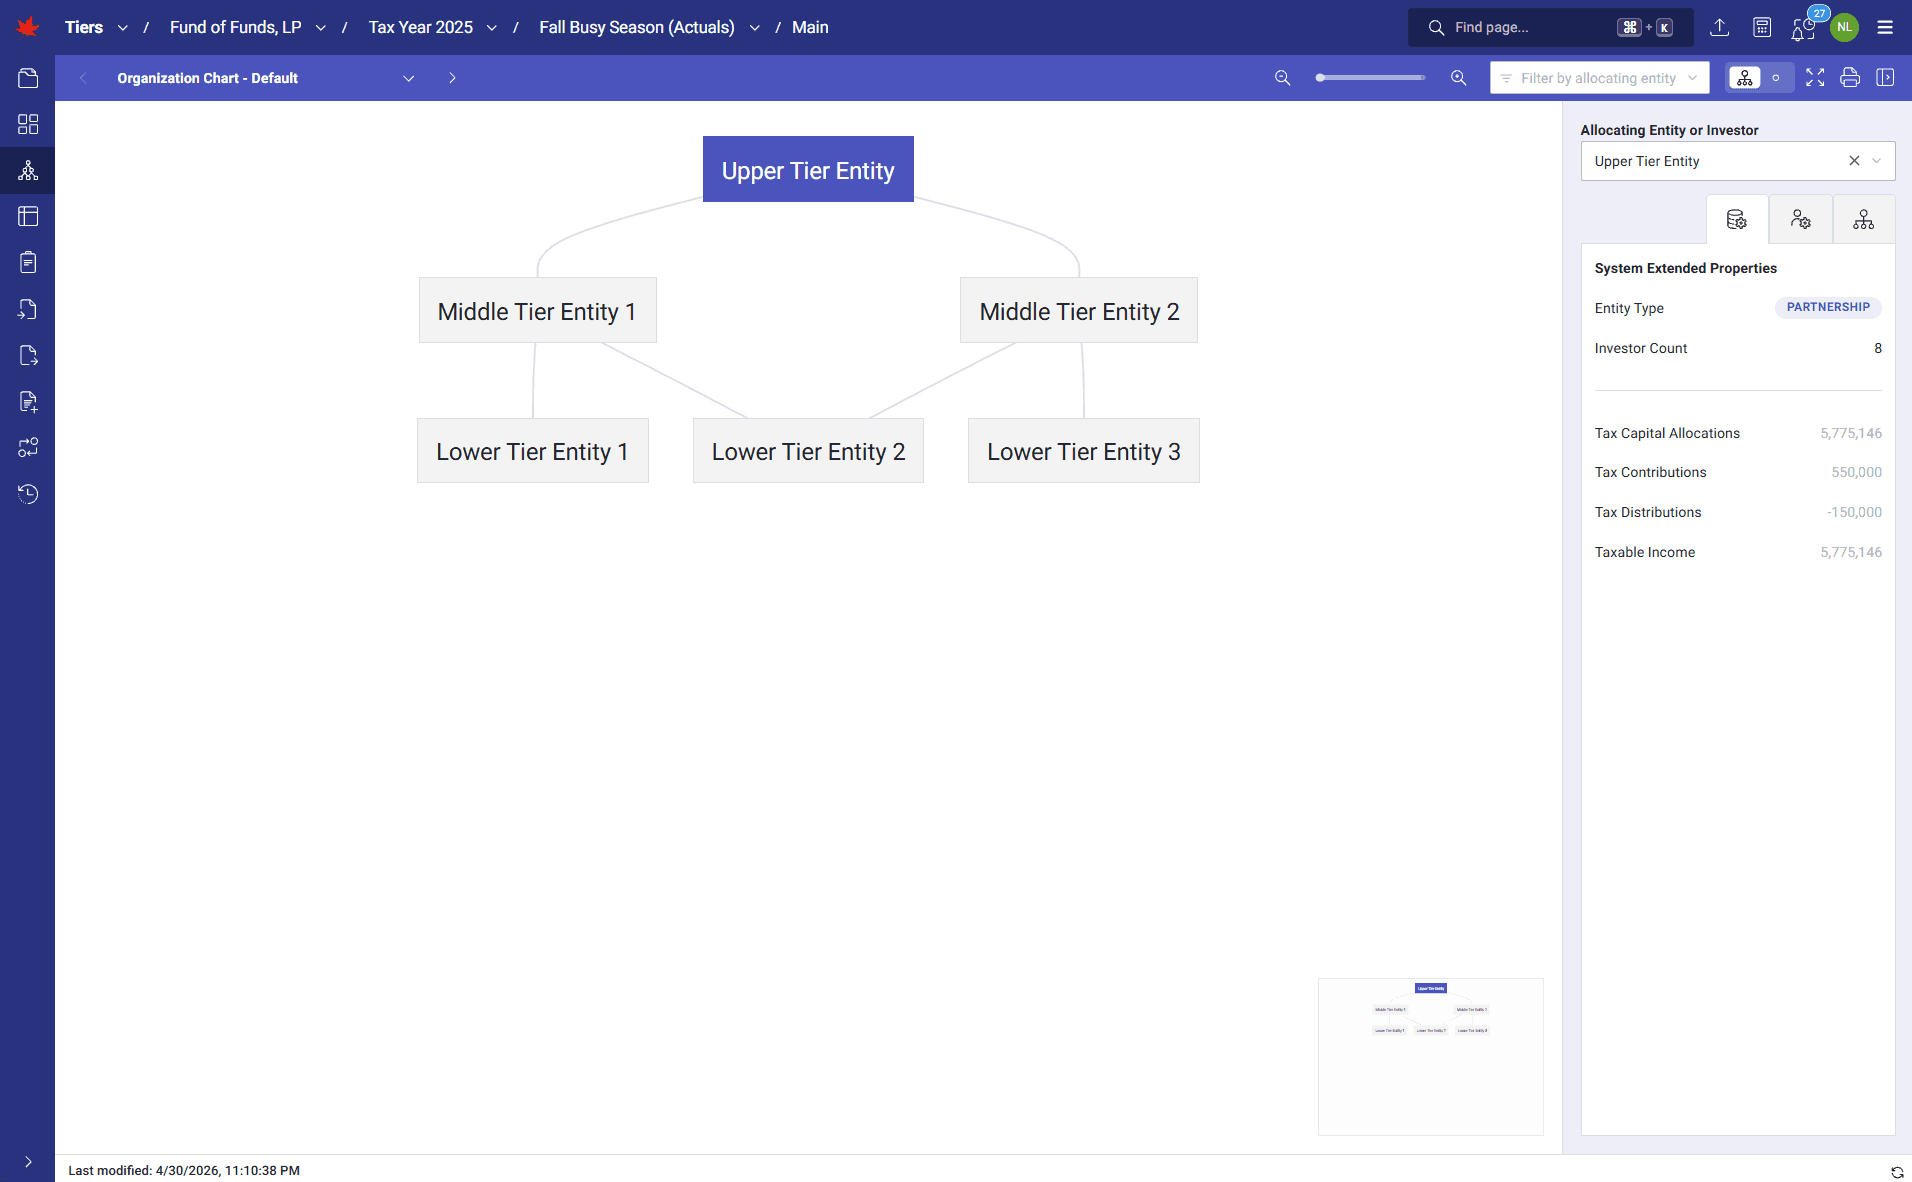
TIERS displays the full tiered partnership structure in an interactive organization chart built from the calculation logic and system outputs. Users can review entities, investors, ownership paths, upper and lower tiers, and key status details in one visual workspace.
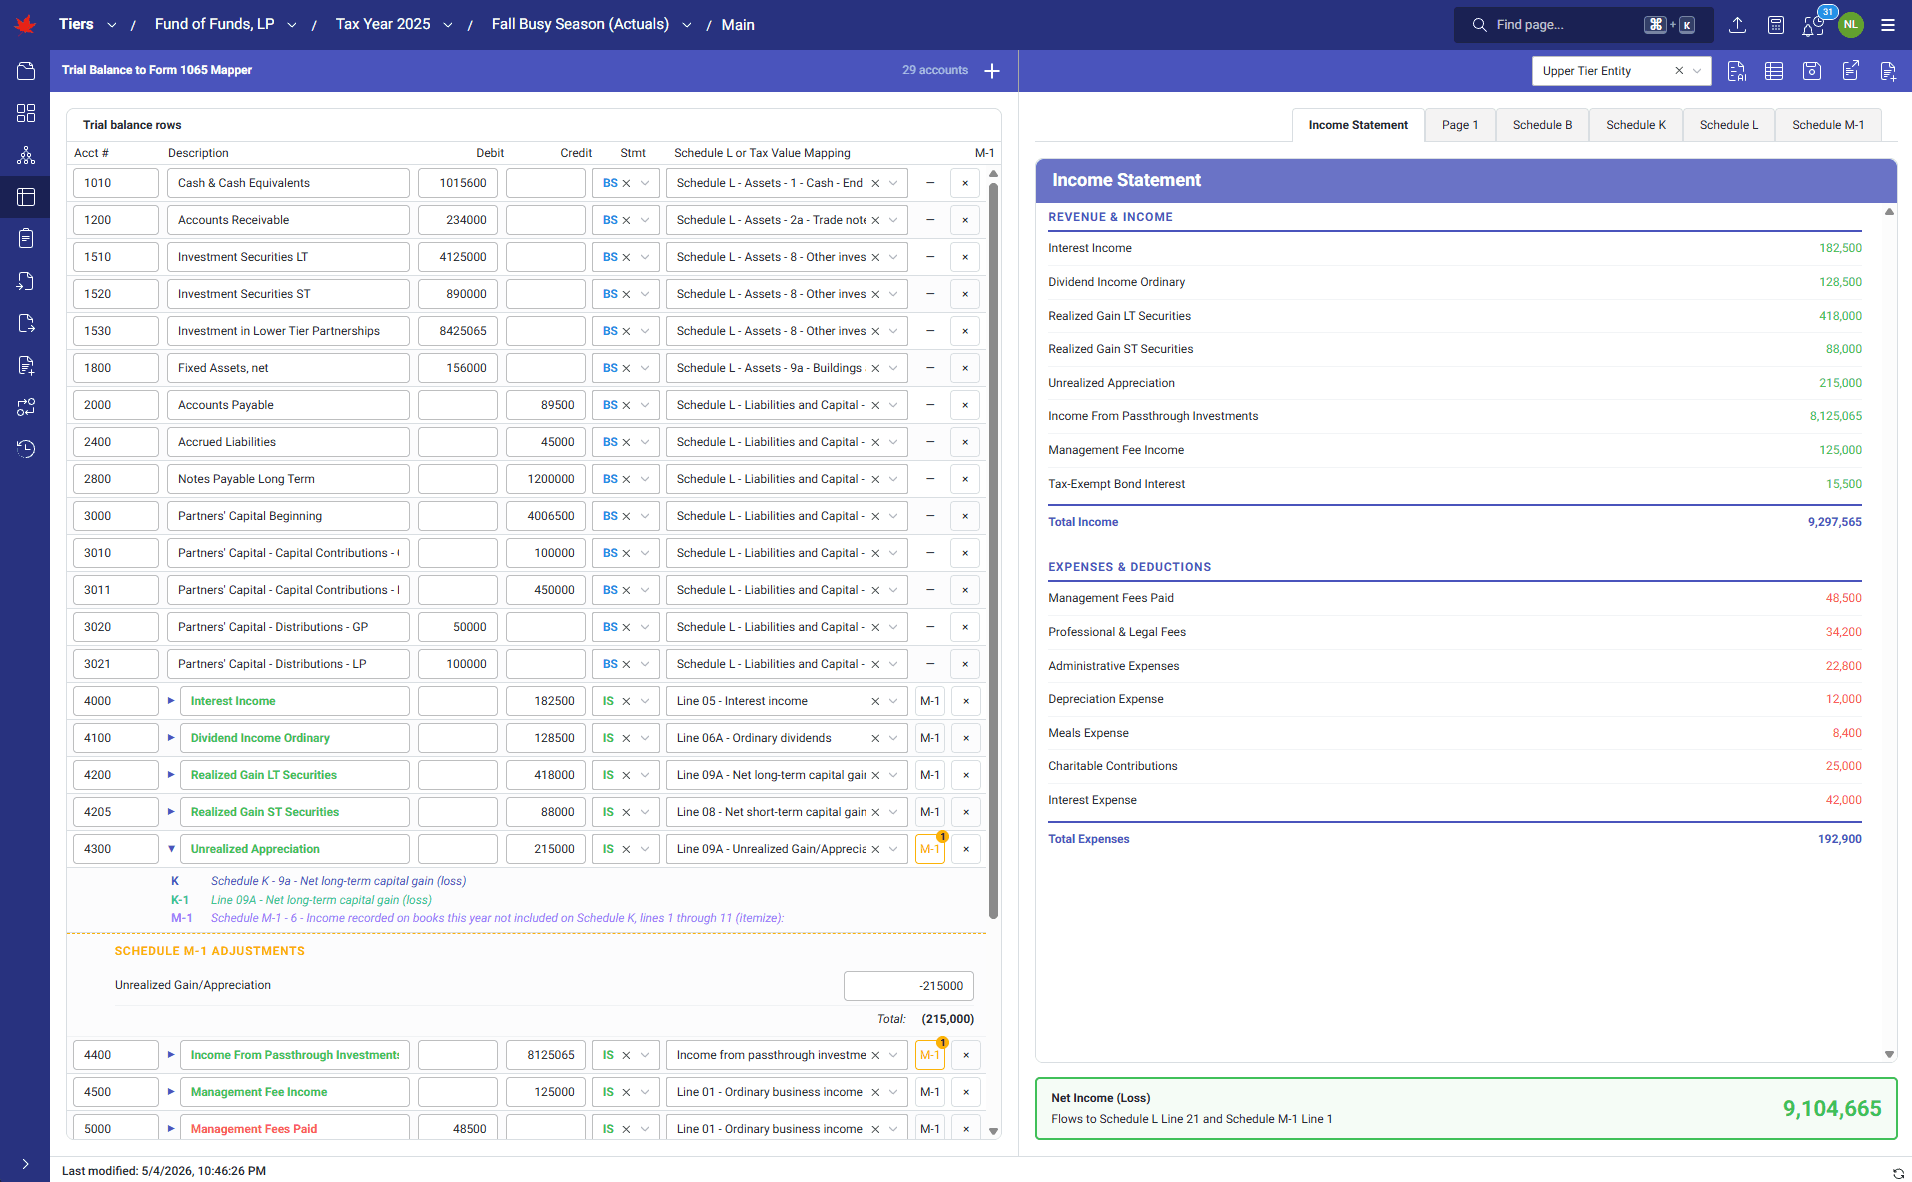
TIERS automates the propagation of tax trial balances into Forms 1065 using automated account classification, mapping, and reconciliation. It carries forward prior-year mappings when available, maps balance sheet accounts to Schedule L, routes income statement accounts to Page 1, Schedule K, M-1, and M-2 through Value Mapping Names, and lets users trace every form line back to the trial balance accounts and adjustments that created it.
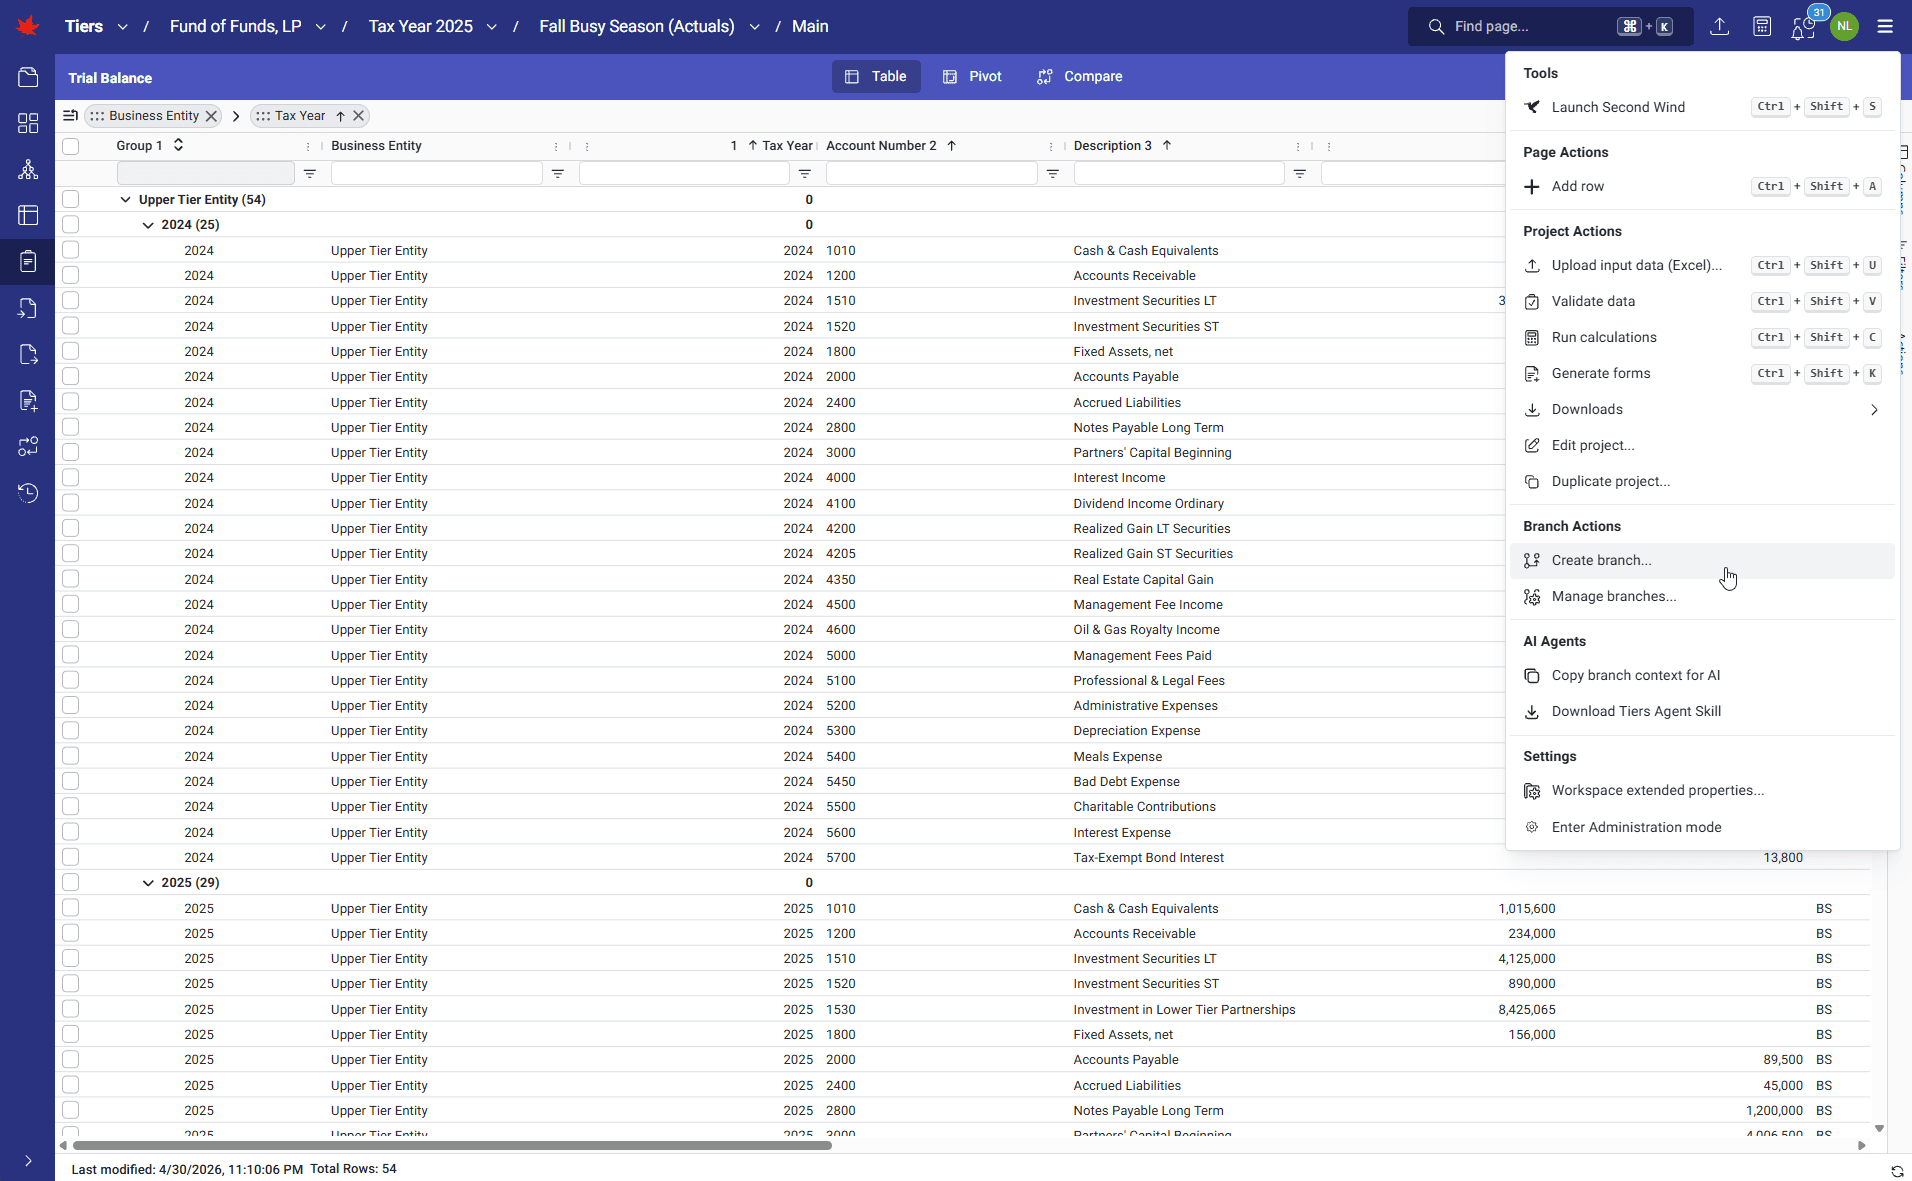
TIERS provides a branching and merging workflow so that multiple users can work on the same partnership tax project without blocking or clobbering each other. A user can snapshot the current project state into an isolated branch, make edits, upload data, run calculations, and merge validated work back to the main dataset when ready.
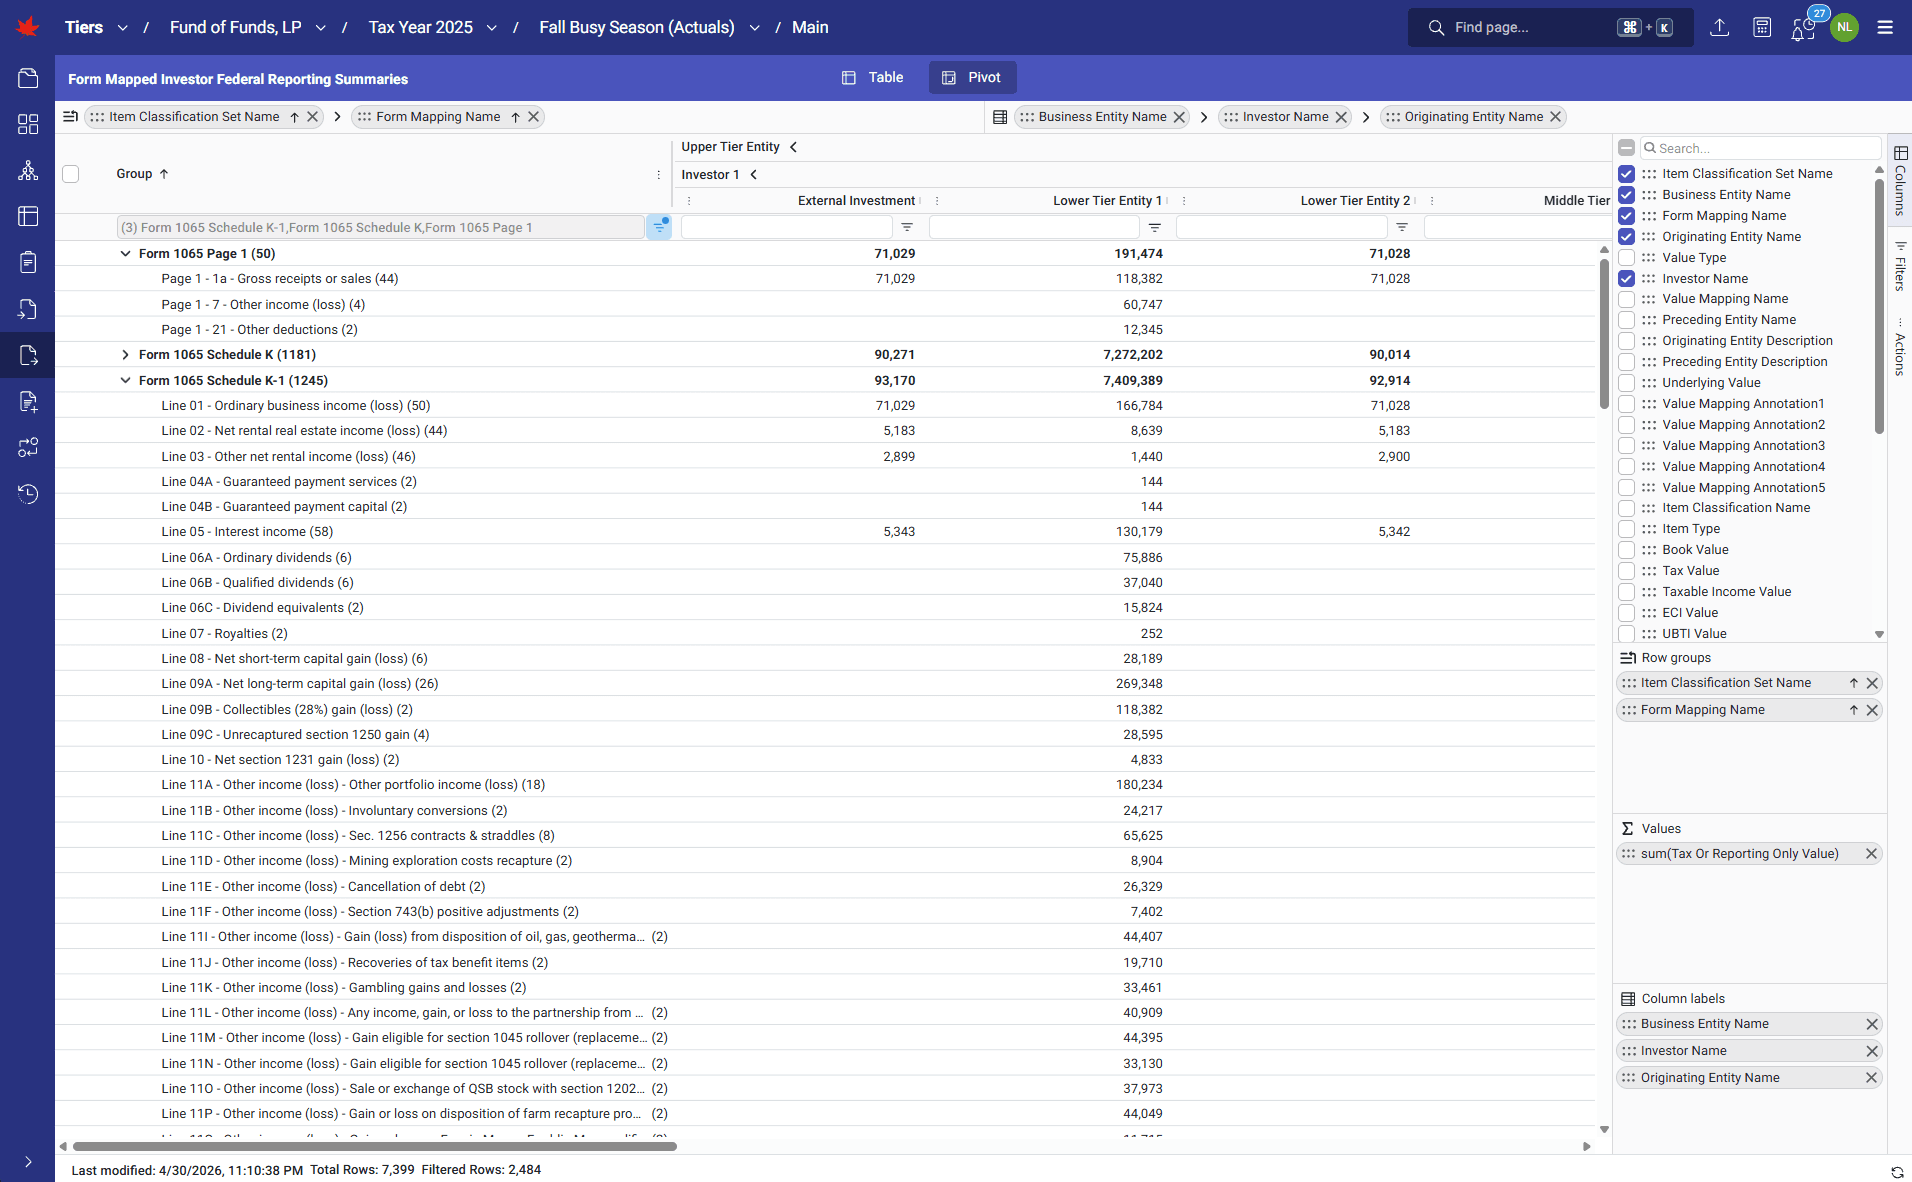
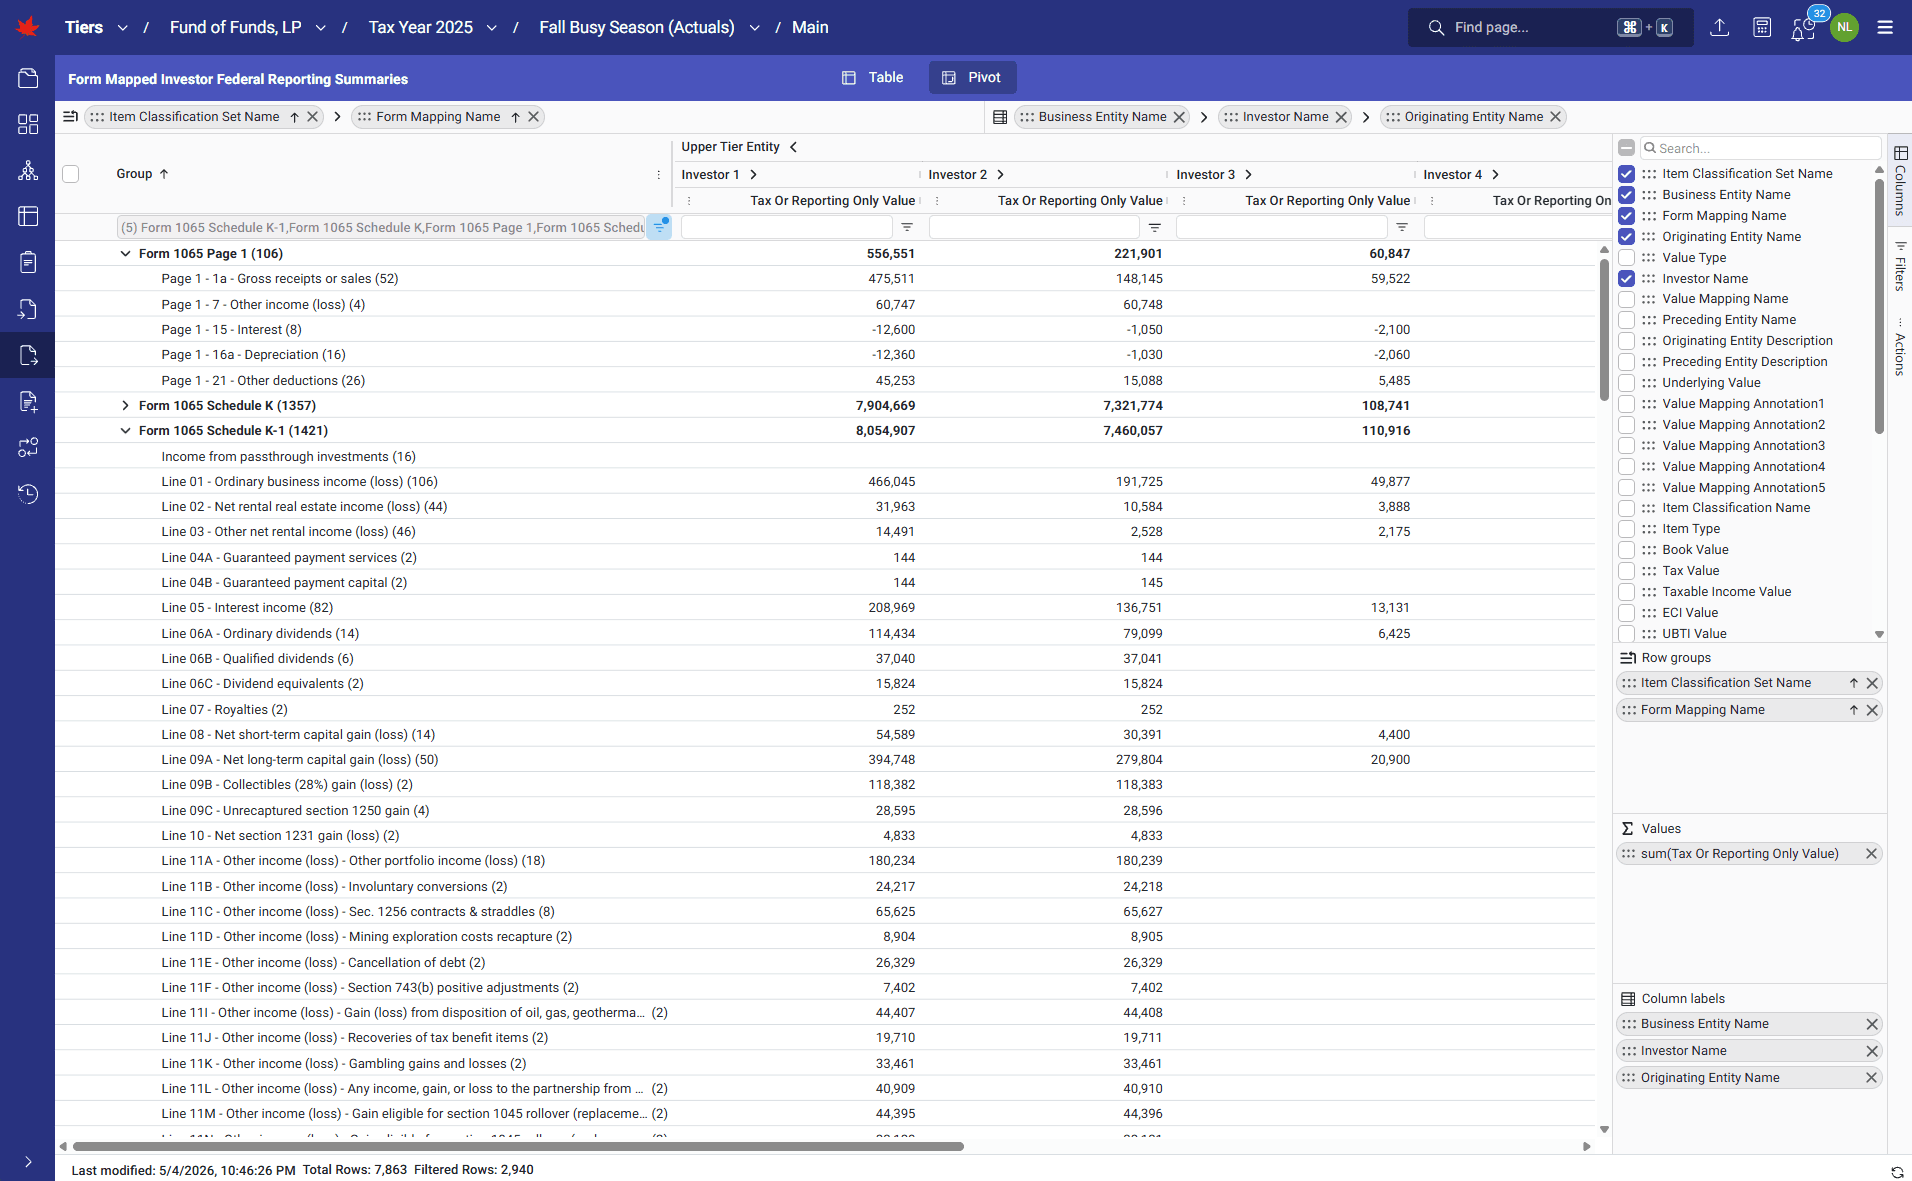
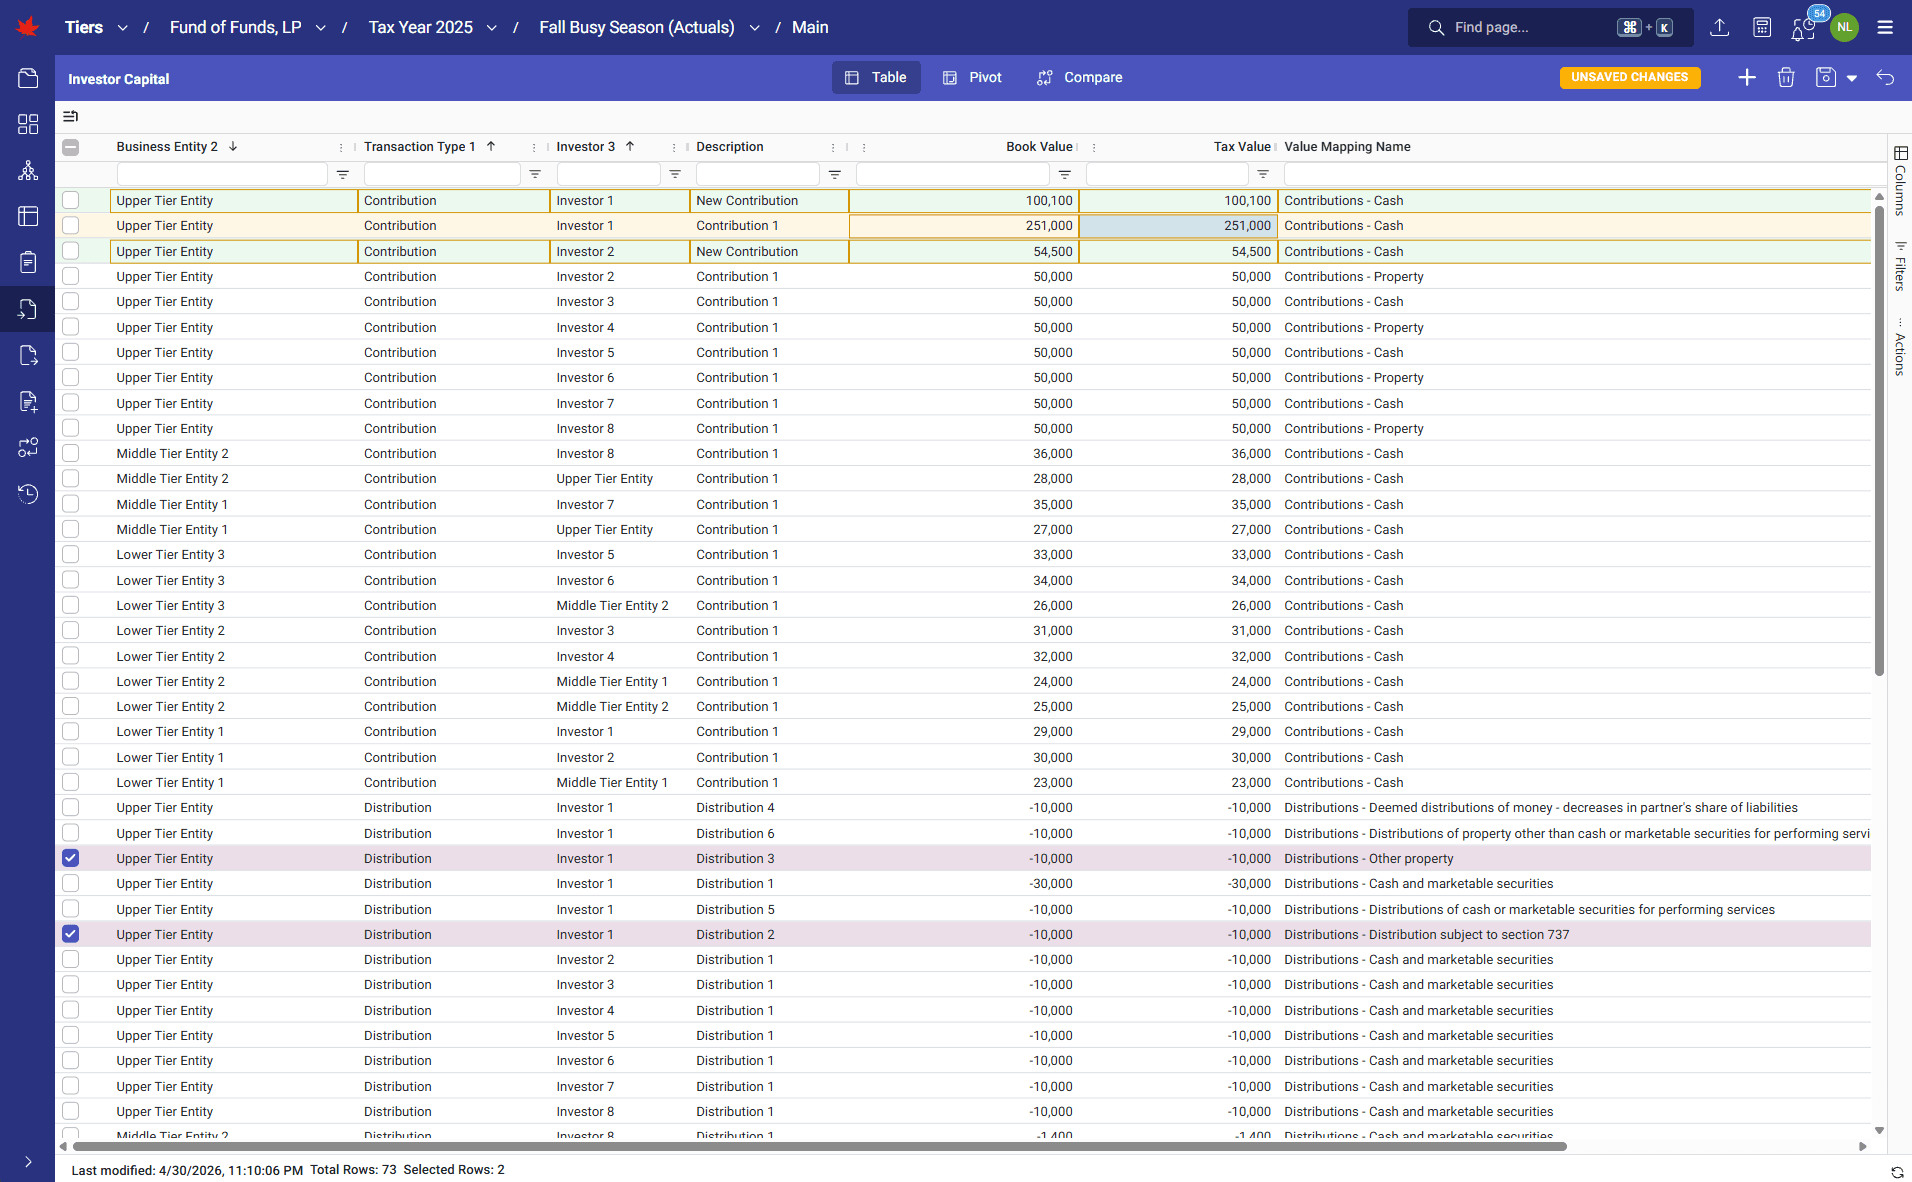
TIERS gives teams direct access to every input and output through configurable self-service tables, pivot views, and Excel or CSV exports. Users can review capital roll-forwards, scan K-1 allocations across an engagement, summarize high-volume output by entity, investor, K-1 line, and sub-line detail, and download data in formats designed for offline review or re-import.
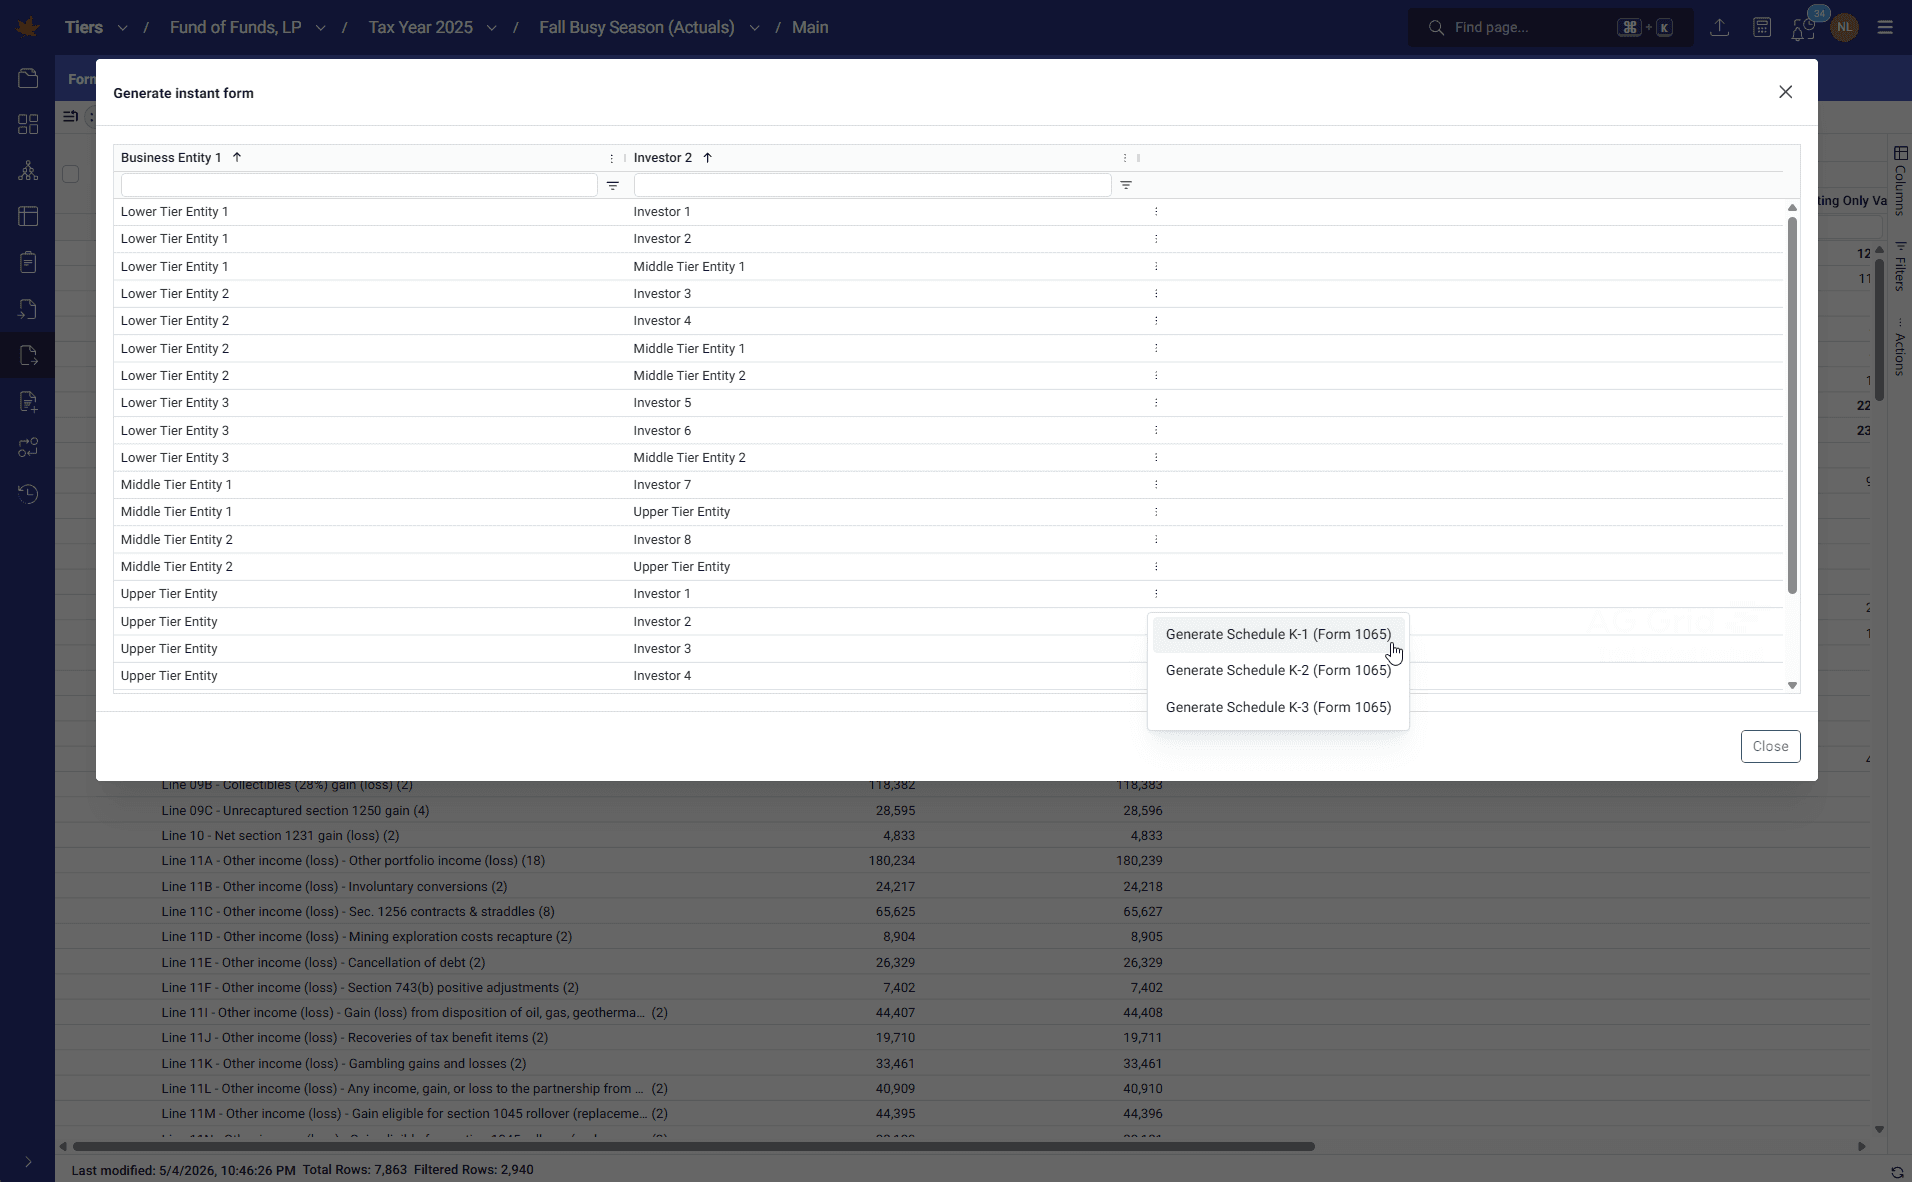
TIERS produces K-1 packages directly from the latest calculation, including form face pages, overflow schedules, detail statements, and dynamic footnotes. AI-native outputs such as JSON, YAML, and Markdown support downstream agentic workflows.
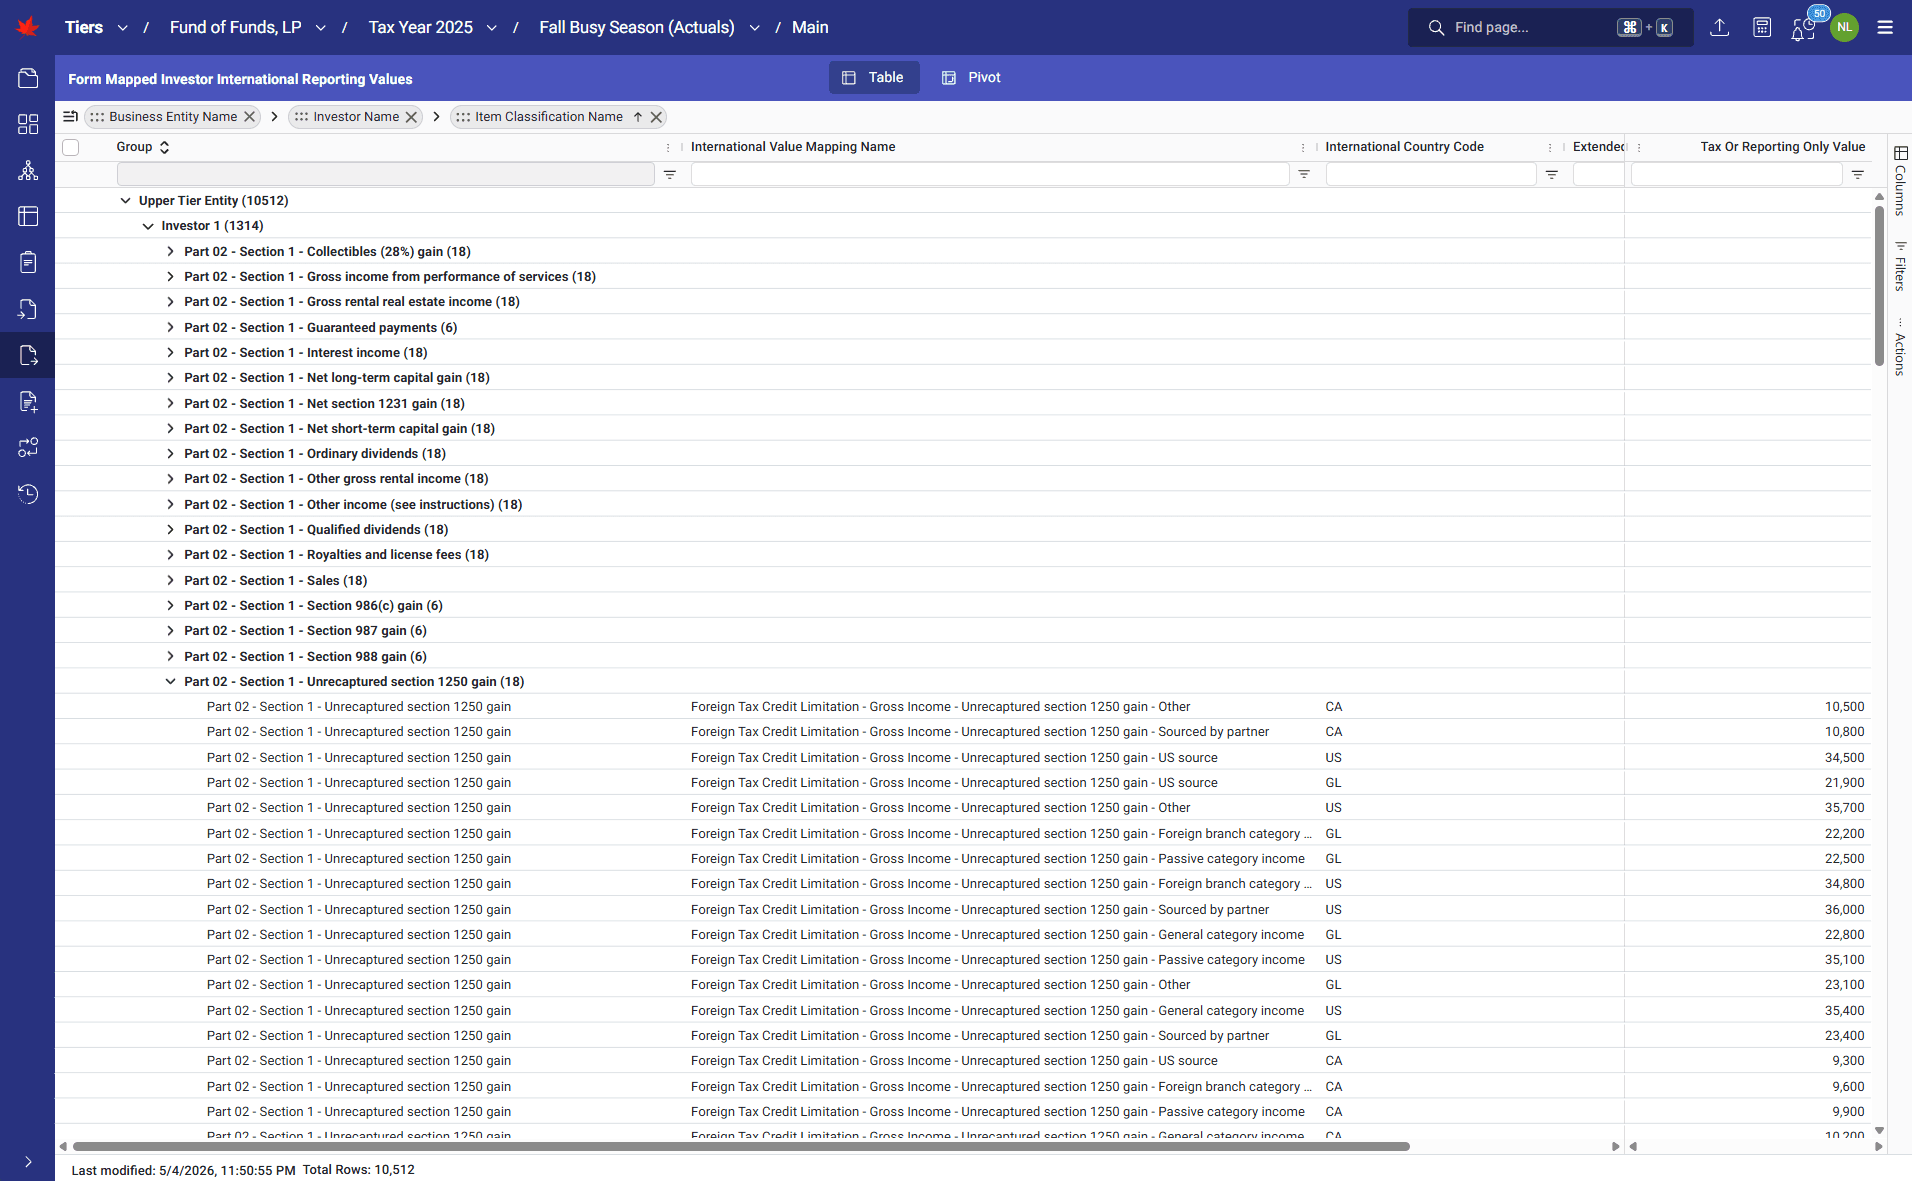
TIERS delivers K-3 and K-2 document production from the same project dataset and calculation passes that generate federal K-1s. TIERS models international reporting with value mappings, country codes, row-level attributes, and the metadata needed to support every required IRS part and section.
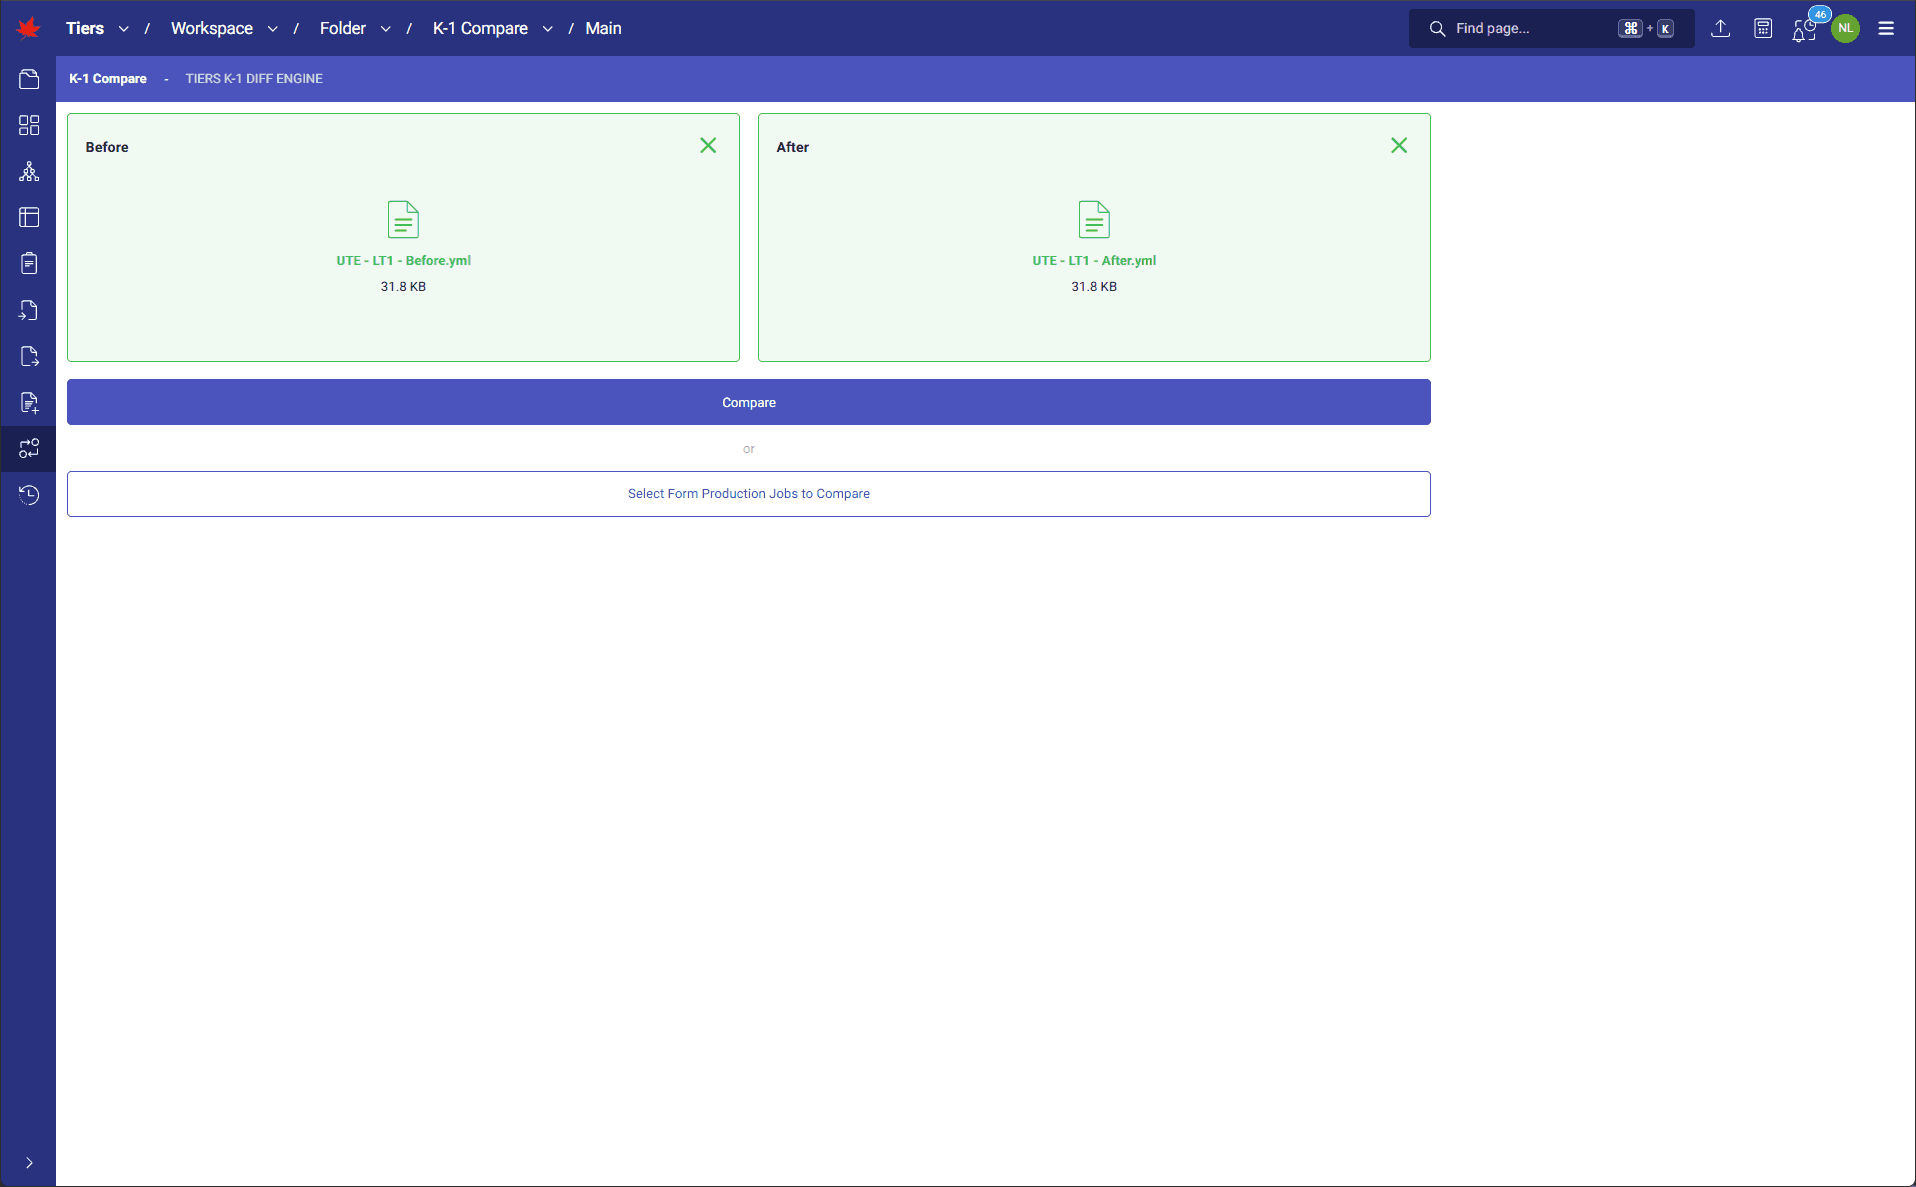
TIERS K-1 comparison function automates before-and-after K-1 review with comparison of normalized, structured files for the same partner and partnership. It shows changes to demographics, face, overflow, and detail values, then helps trace those changes back to the data, calculations, and tiering paths that caused them.
TIERS records every insertion, update, and deletion in an append-only journal so teams can see how their projects evolved from the first upload to final delivery. Users can review timestamps, user attribution, and before-and-after field values. They can even restore copies of prior versions for investigation, comparison, and scenario testing.
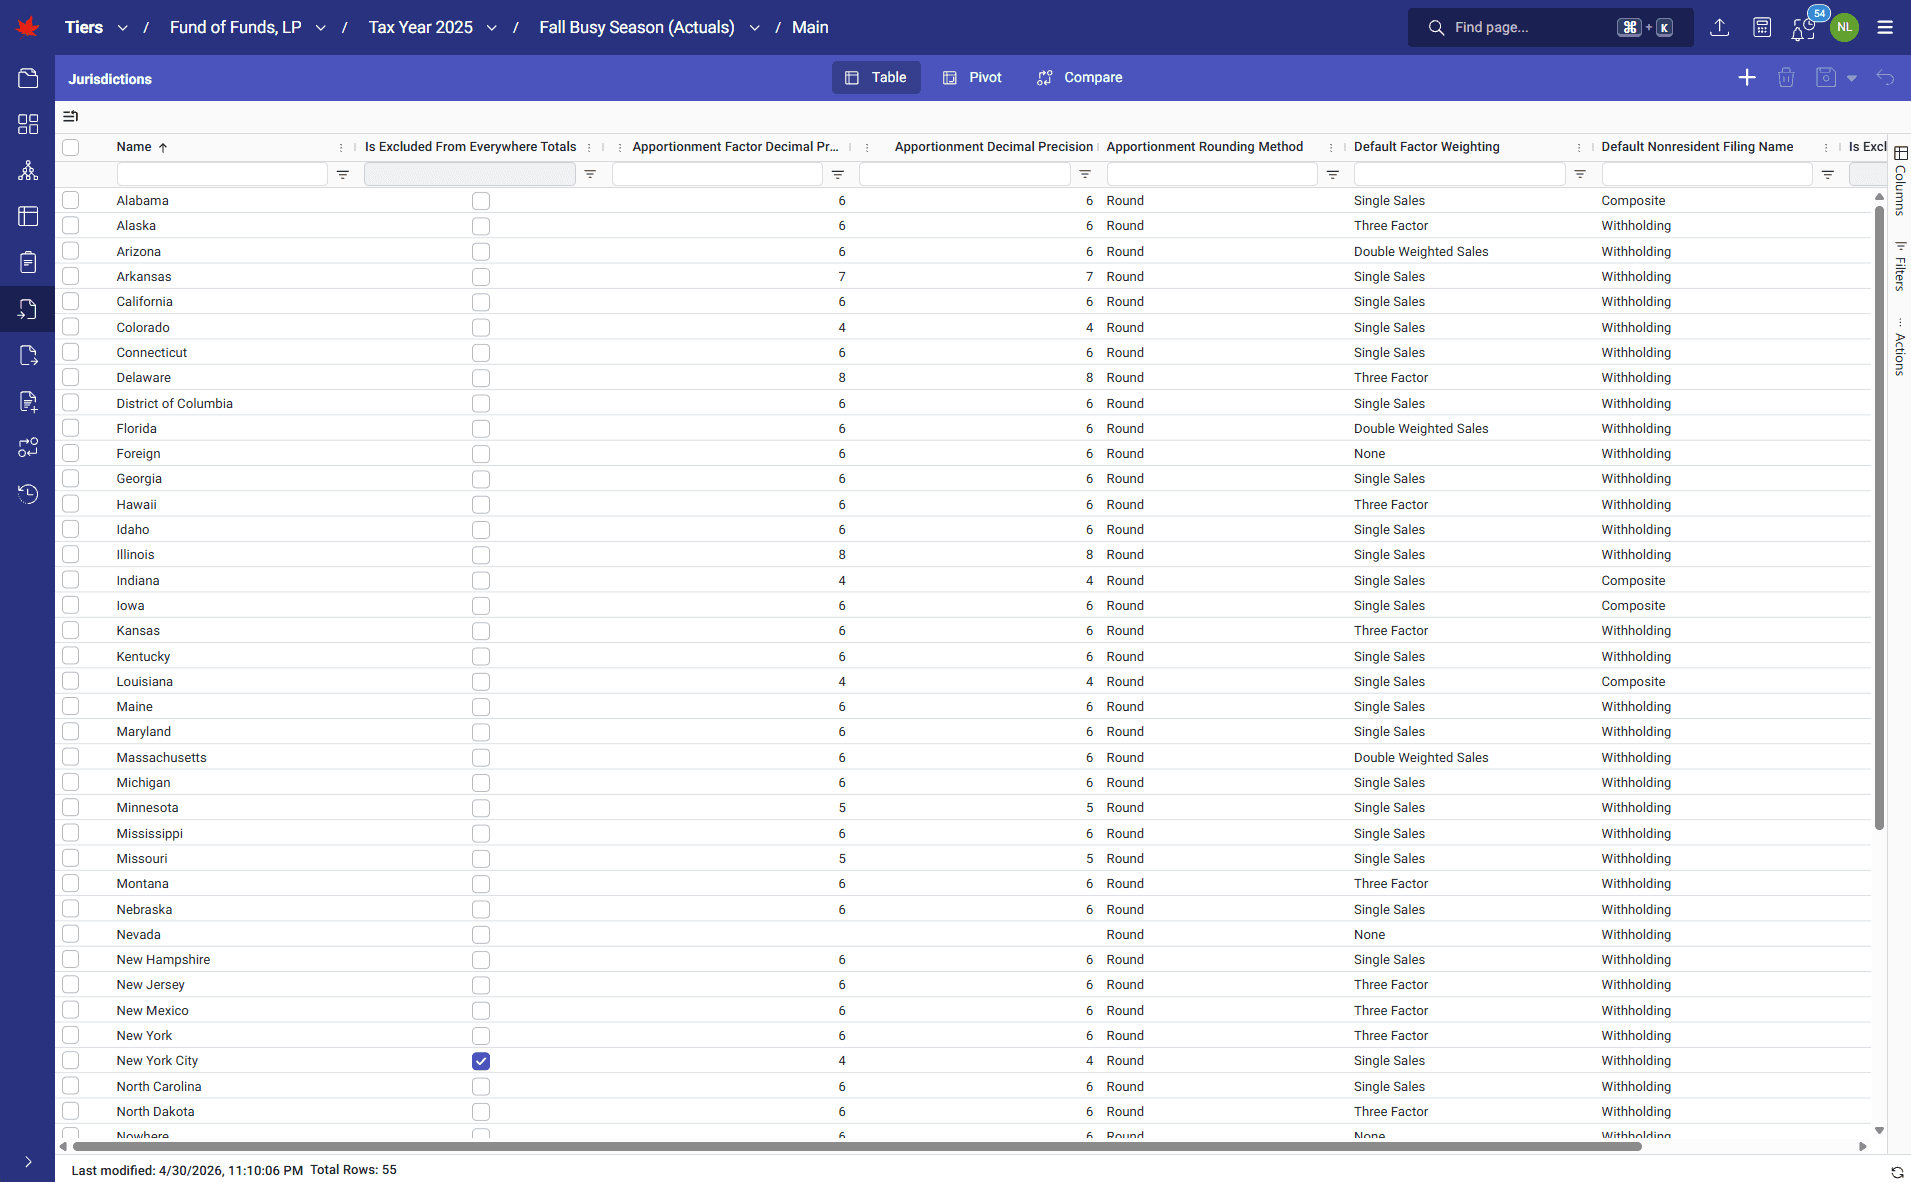
TIERS calculates state allocation and apportionment, nonresident filing assignments, taxes due, and payment tracking in the same project datasets used for federal and international reporting. Federal and state reporting comes from the same unified sources, tied to the same entities, items, attributes, investors, and filings, remaining synchronized as project data changes.
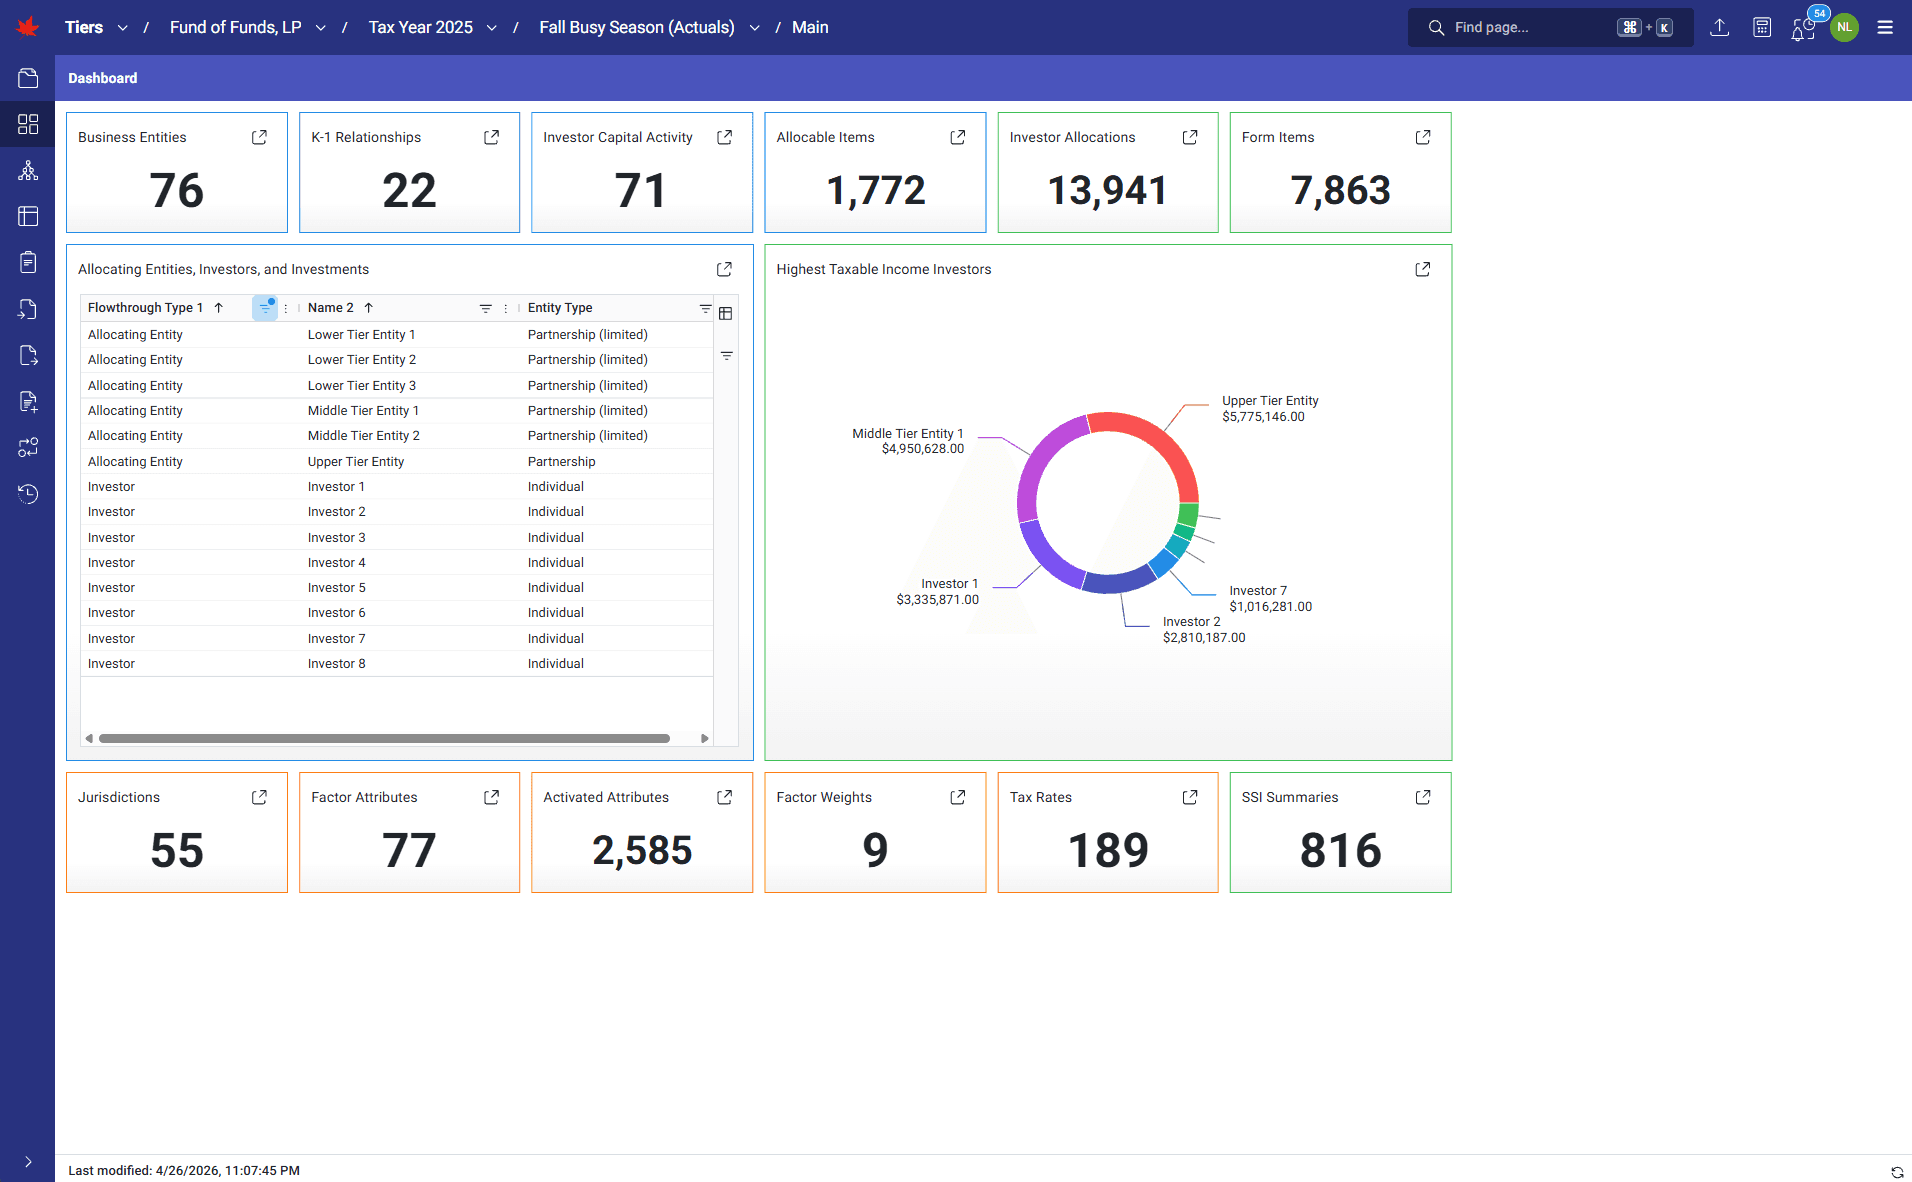
TIERS' dashboards give users an immediate read on their engagements through configurable count cards, list cards, charts, and Power BI template widgets. Teams can quickly understand project status, open related inputs or outputs, review selected live data, and download Power BI templates with the TIERS data they depend upon.